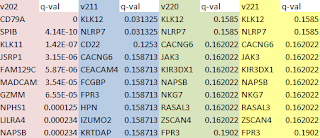
I was working through my RNA-seq tutorial with a group of students this week and they pointed out that my tutorial worksheet was wrong. Cufflinks did not produce any significant DE genes with our test data comparing two small RNA-seq data files. This was surprising to me, since I did the exact same workflow with the same data files last year and it worked out fine. So golly and darn it, I got hit with the irreproducible results bug. We keep past versions of software available on our computing server with an Environment Modules system, so I was able to quickly run a test of the exact same data files (aligned with the same Tophat version to the same reference genome) using different versions of Cufflinks. We have the following versions installed:
cufflinks/2.0.2 (July 2012)
cufflinks/2.1.1 (April 2013)
cufflinks/2.2.0 (March 2014)
cufflinks/2.2.1 (May 2014)
I just used the simple Cuffidiff workflow and looked at the gene_exp.diff output file for each software version. The results are quite different. Version 2.0.2 has 46 genes called "significant=yes" (multi-test adjusted q-value less than 0.05) with q-values running as low as 4.14E-10 (ok, one has a q-value of zero). Now this is not a great result from a biostatistics standpoint, since how can you expect to get significant p-values from RNA expression levels with two samples an no replicates? But it did make for an expedient exercise, since we could take the DE genes into DAVID and look for enriched biological functions and pathways.
Then in version 2.1.1 we have two "significant=yes" genes. In version 2.2.0 we have zero significant genes, and in version 2.2.1 also zero.
The top 10 genes, ranked by q-value also differ. There are no genes in common between the top 10 list for version 2.0.2 and 2.1.1, and only the top 2 genes are shared by version 2.2.0. Thankfully, there are no differences in top genes or q-values between 2.2.0 and 2.2.1 (versions released only 2 months apart). I'm sure that Cole Trapnell et al. are diligently improving the software, but the consequences for those of us trying to use the tools to make some sense out of biology experiments can be unsettling.
